4 Peak Annotations
Based on the consensus peaks (see here)
Software used: ChIPseeker & deepTools
- Below shows top 10 peaks (based on the p-values of each peak)
- Annotated peaks are available to download from here
4.1 No. of peaks by group
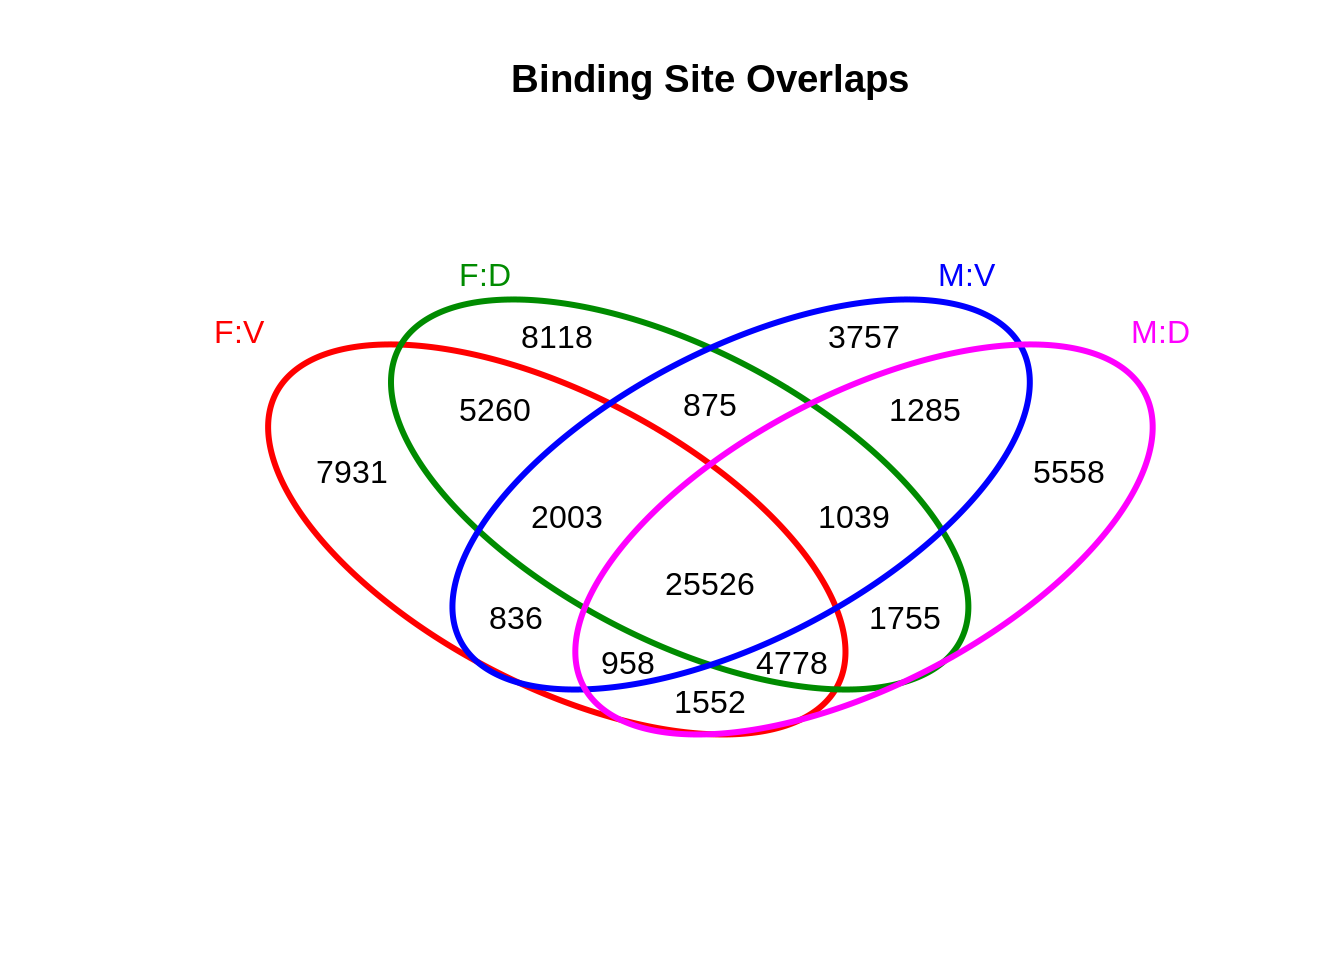
Figure 4.1: Venn Diagram of peak overlaps (all samples)
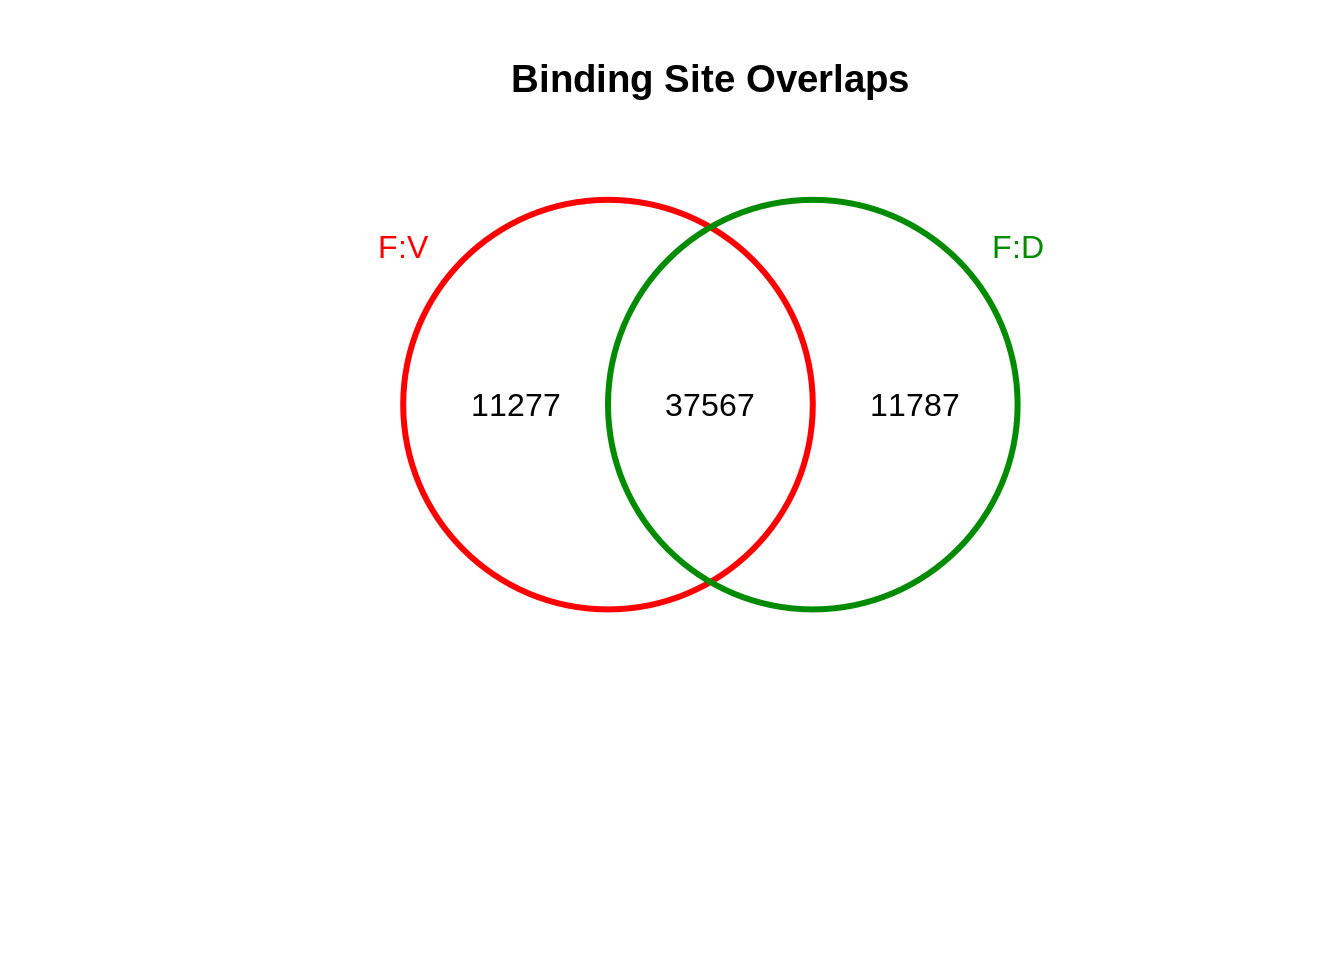
Figure 4.2: Venn Diagram of peak overlaps (female only)
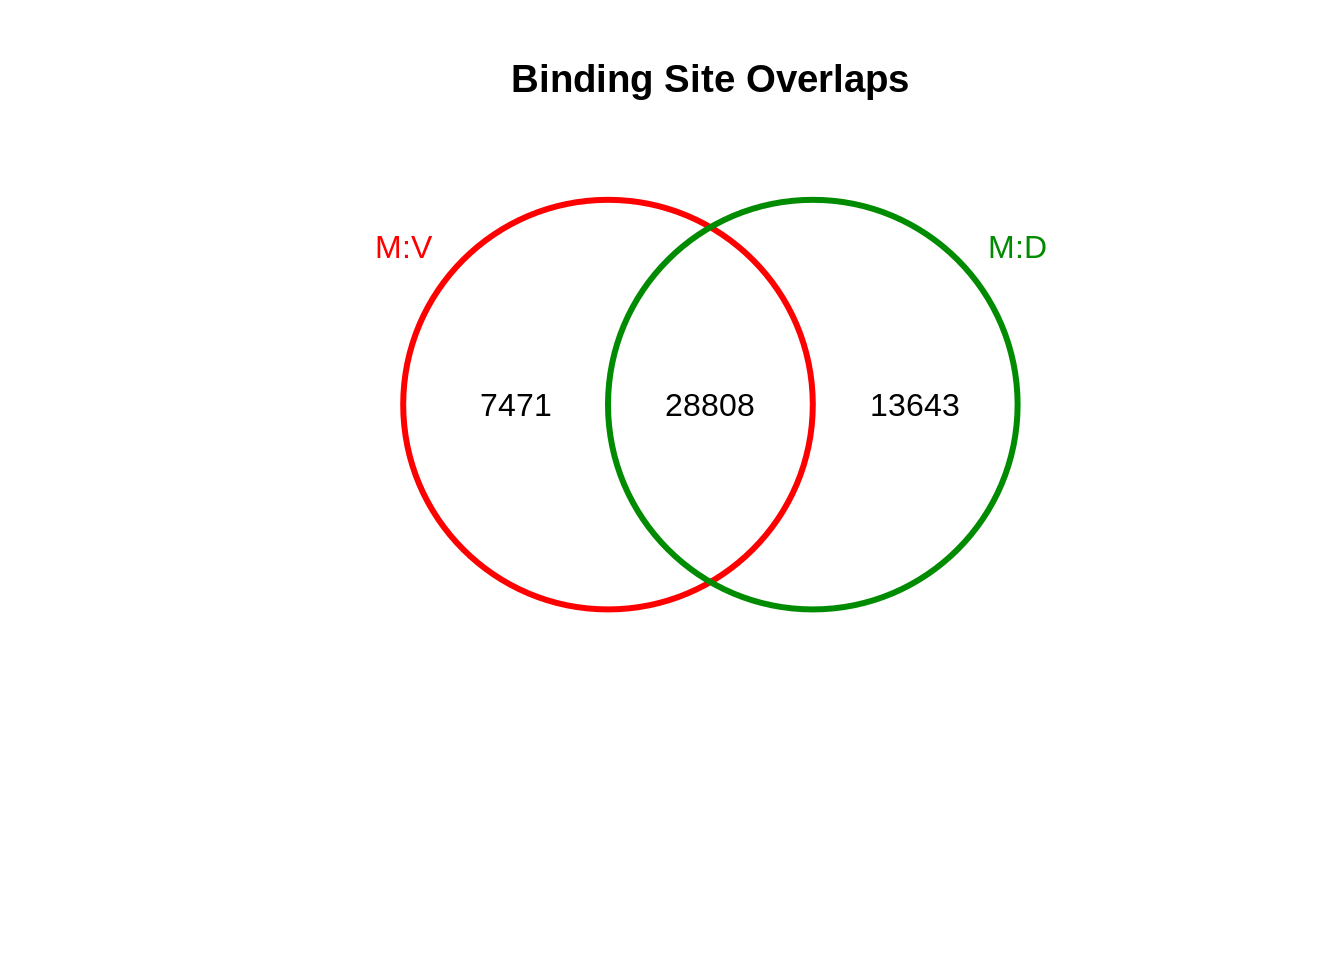
Figure 4.3: Venn Diagram of peak overlaps (male only)
4.2 No. of peaks by chromosome
| seqnames | FD | FV | MD | MV |
|---|---|---|---|---|
| 1 | 5974 | 5970 | 4926 | 4729 |
| 2 | 4026 | 4018 | 3245 | 3102 |
| 3 | 3261 | 3291 | 2582 | 2516 |
| 4 | 1876 | 1923 | 1436 | 1313 |
| 5 | 2635 | 2717 | 2059 | 1933 |
| 6 | 3115 | 3182 | 2465 | 2214 |
| 7 | 2784 | 2824 | 2252 | 2106 |
| 8 | 2070 | 2100 | 1659 | 1544 |
| 9 | 2655 | 2734 | 2261 | 2224 |
| 10 | 2514 | 2519 | 2005 | 1892 |
| 11 | 3324 | 3403 | 2798 | 2818 |
| 12 | 2695 | 2744 | 2170 | 2049 |
| 13 | 940 | 958 | 748 | 657 |
| 14 | 1996 | 2002 | 1617 | 1600 |
| 15 | 1897 | 1842 | 1594 | 1450 |
| 16 | 2373 | 2336 | 2173 | 2086 |
| 17 | 3271 | 3186 | 2759 | 2783 |
| 18 | 908 | 881 | 719 | 632 |
| 19 | 3477 | 3345 | 2987 | 2821 |
| 20 | 1766 | 1709 | 1441 | 1432 |
| 21 | 520 | 519 | 405 | 386 |
| 22 | 1643 | 1616 | 1417 | 1432 |
| X | 989 | 933 | 831 | 664 |
4.3 No. of genes enrichred in peaks
4.3.1 Non-intergenic peaks only
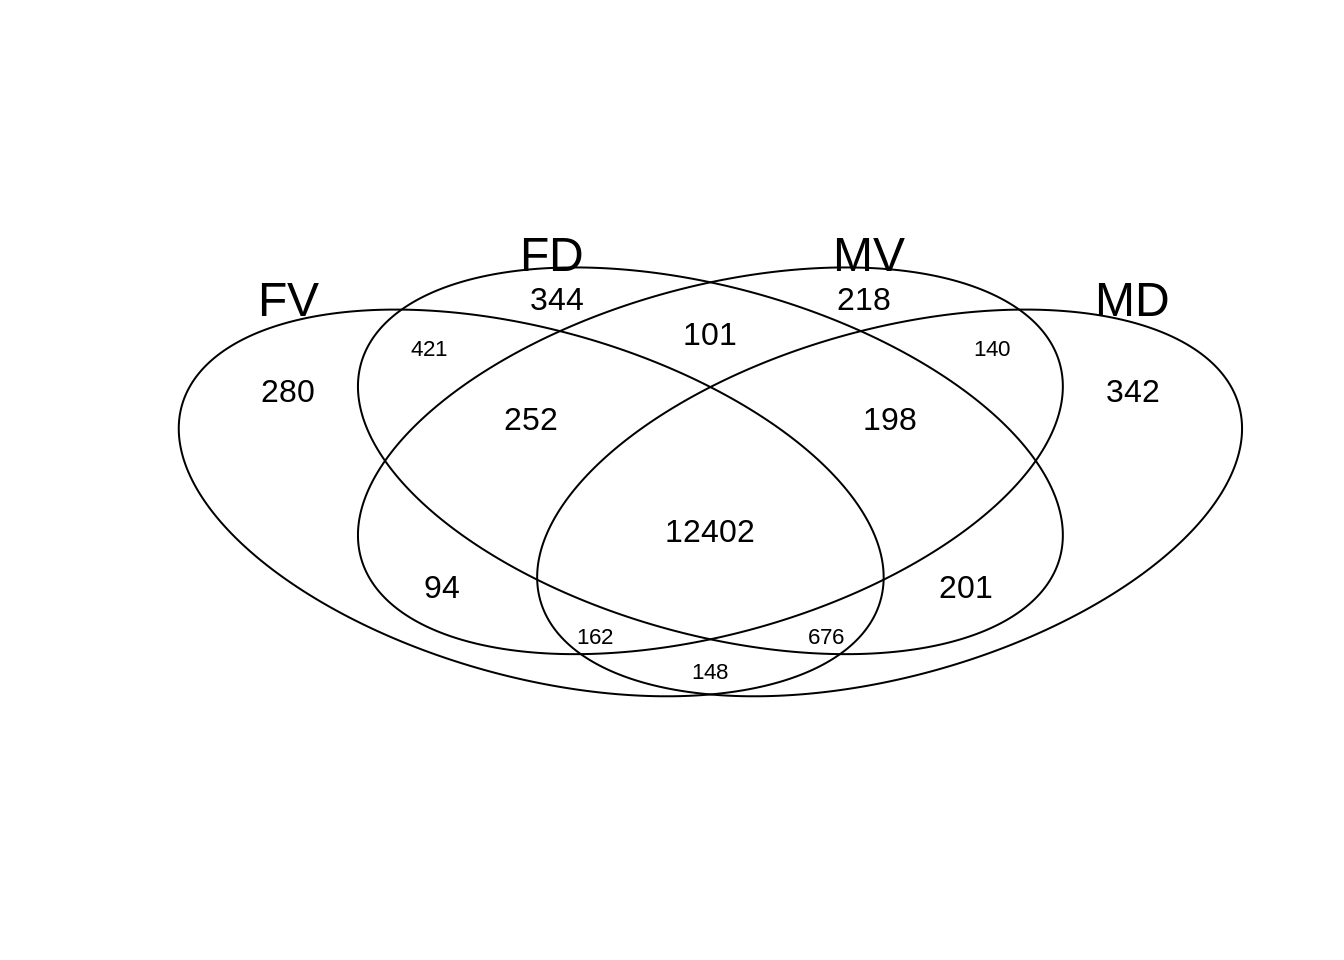
Figure 4.4: Venn diagram showing the number of enriched genes
4.3.2 Peaks in TSS (<2kb)
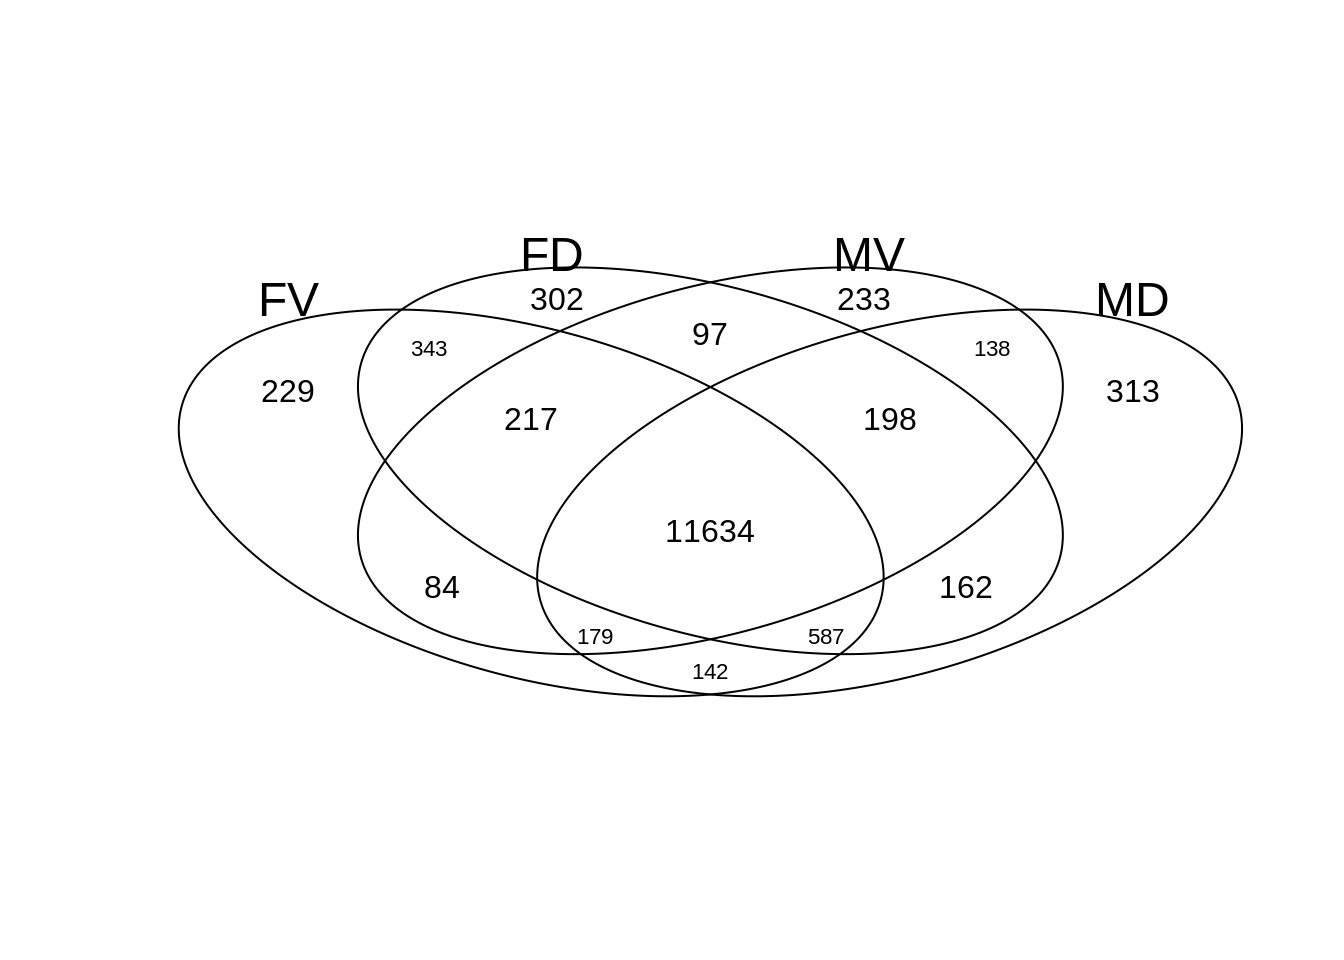
Figure 4.5: Venn diagram showing the number of enriched genes
4.4 Genomic feature of peaks
| Feature | FD | FV | MD | MV |
|---|---|---|---|---|
| Promoter (<=1kb) | 44.86 | 45.21 | 49.31 | 51.13 |
| Promoter (1-2kb) | 6.44 | 6.41 | 5.82 | 6.02 |
| 5’ UTR | 0.27 | 0.26 | 0.32 | 0.26 |
| 3’ UTR | 1.91 | 1.94 | 2.22 | 1.98 |
| 1st Exon | 1.36 | 1.25 | 1.37 | 1.19 |
| Other Exon | 2.43 | 2.35 | 2.63 | 2.43 |
| 1st Intron | 10.99 | 11.14 | 9.85 | 9.45 |
| Other Intron | 14.41 | 14.05 | 12.34 | 11.71 |
| Downstream (<=300) | 0.73 | 0.72 | 0.79 | 0.74 |
| Distal Intergenic | 16.59 | 16.66 | 15.37 | 15.09 |
| Feature | FD | FV | MD | MV |
|---|---|---|---|---|
| Promoter (<=1kb) | 25439 | 25660 | 22952 | 22691 |
| Promoter (1-2kb) | 3653 | 3638 | 2708 | 2672 |
| 5’ UTR | 155 | 149 | 149 | 117 |
| 3’ UTR | 1085 | 1100 | 1032 | 879 |
| 1st Exon | 774 | 712 | 636 | 530 |
| Other Exon | 1377 | 1335 | 1226 | 1079 |
| 1st Intron | 6235 | 6321 | 4584 | 4195 |
| Other Intron | 8172 | 7975 | 5742 | 5196 |
| Downstream (<=300) | 413 | 407 | 366 | 327 |
| Distal Intergenic | 9406 | 9455 | 7154 | 6697 |
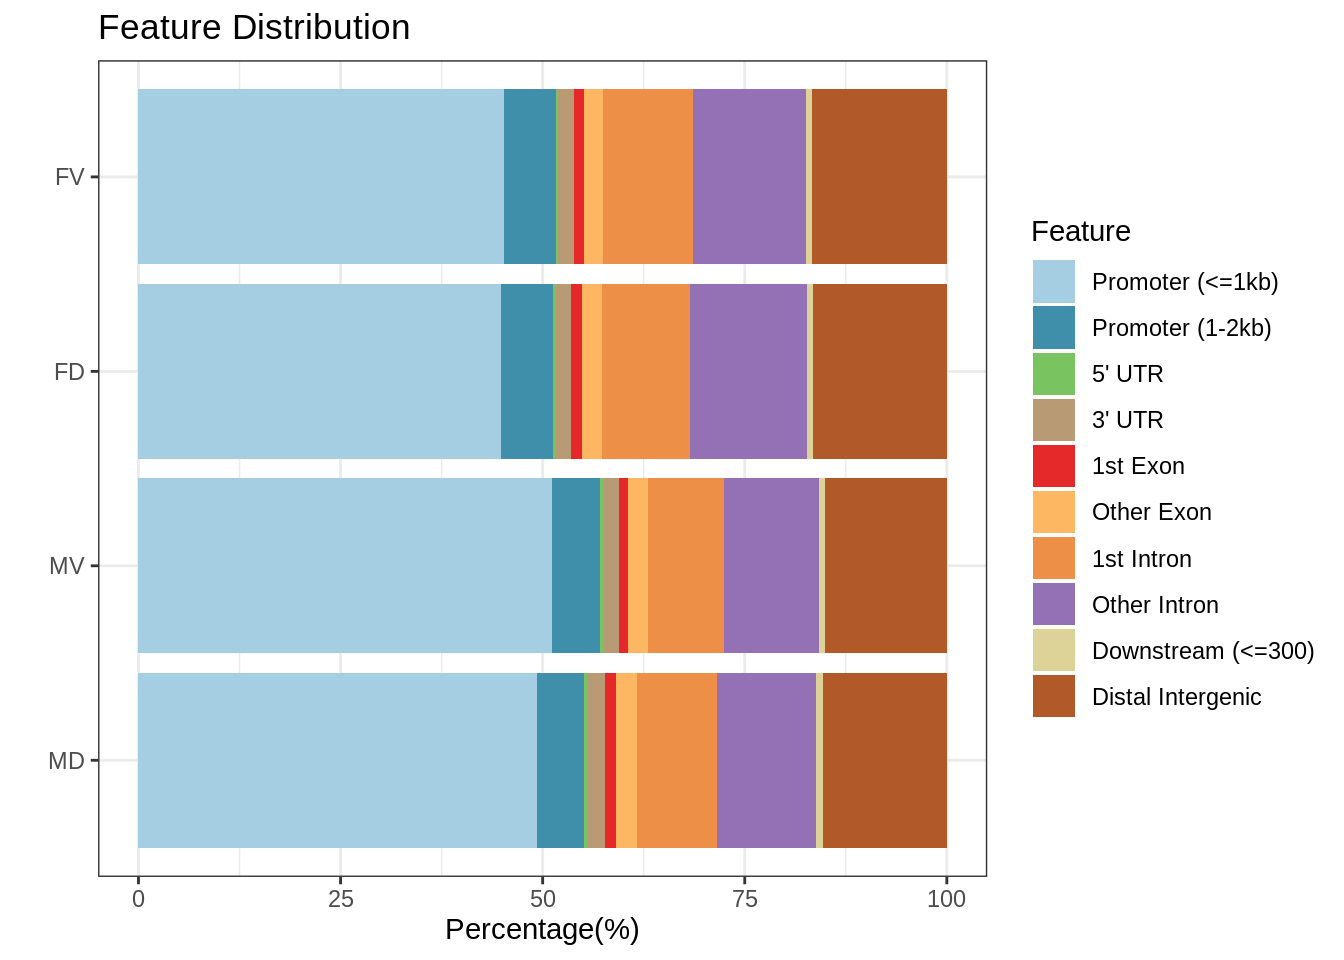
Figure 4.6: Genomic feautres of peaks
4.5 Distance to TSS
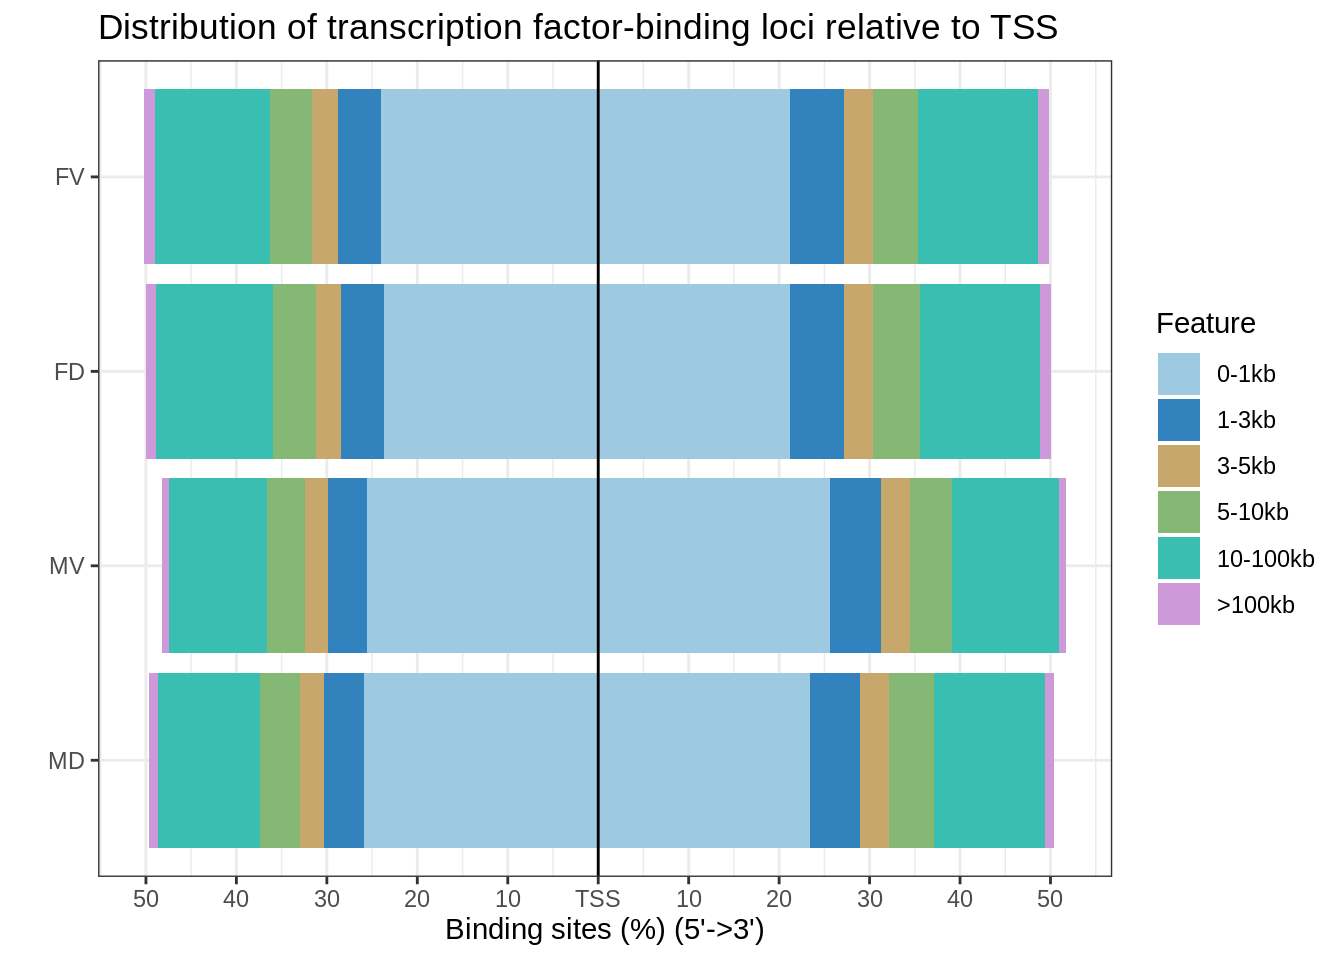
Figure 4.7: Distance to TSS
4.6 Peak frequency over TSS
## >> preparing promoter regions...  2021-02-16 21:47:37
## >> preparing tag matrix...        2021-02-16 21:47:38
## >> plotting figure...             2021-02-16 21:47:59
## >> preparing promoter regions... 2021-02-16 21:48:00
## >> preparing tag matrix... 2021-02-16 21:48:00
## >> plotting figure... 2021-02-16 21:48:11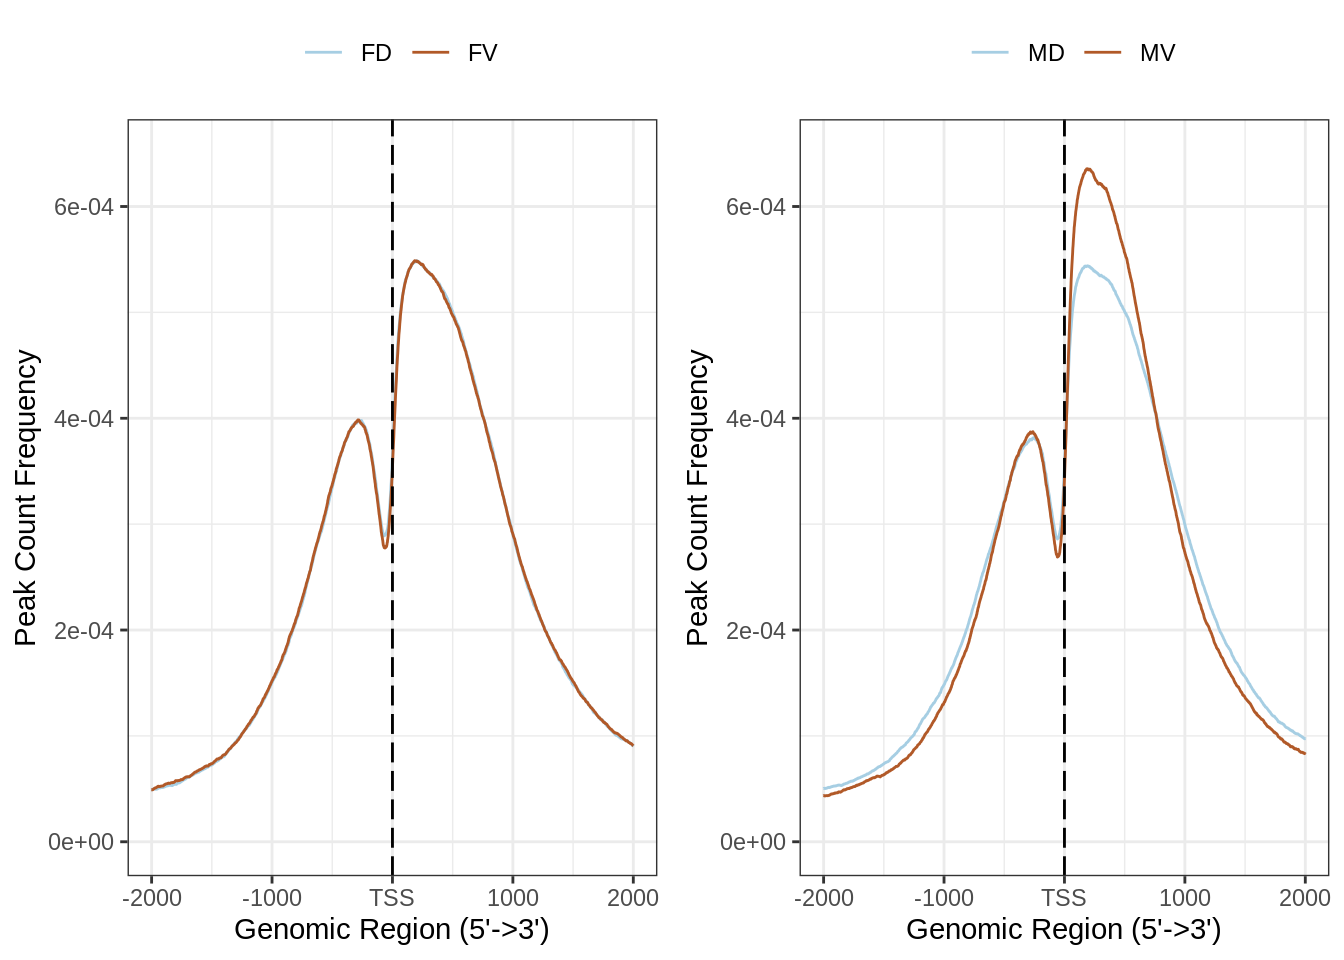
Figure 4.8: Peak frequency over TSS (<2kb)
## >> preparing promoter regions...  2021-02-16 21:48:12
## >> preparing tag matrix...        2021-02-16 21:48:12
## >> plotting figure...             2021-02-16 21:48:54
## >> preparing promoter regions... 2021-02-16 21:48:54
## >> preparing tag matrix... 2021-02-16 21:48:55
## >> plotting figure... 2021-02-16 21:49:29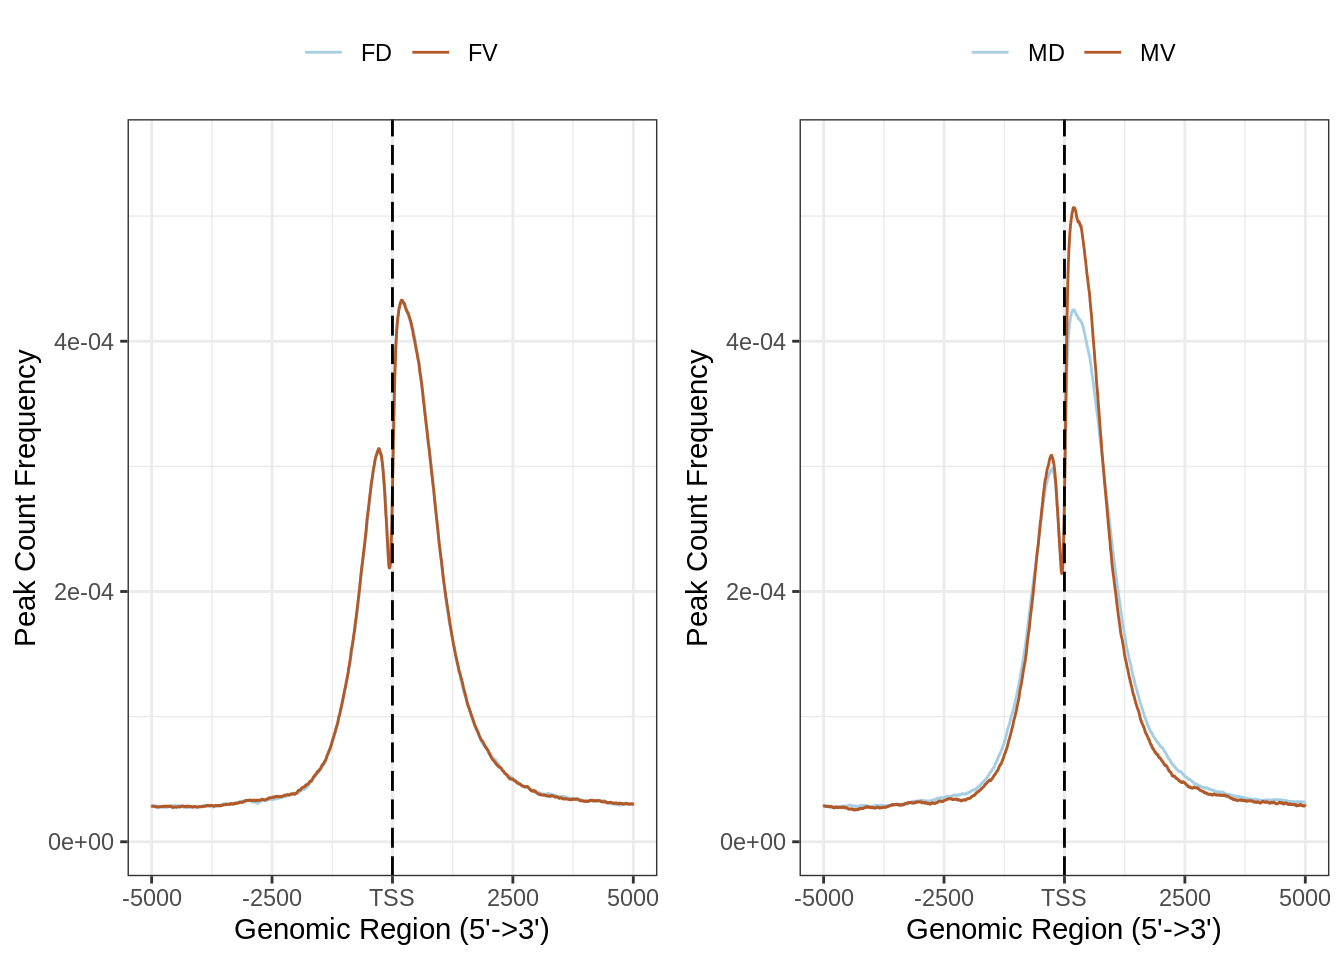
Figure 4.9: Peak frequency over TSS (<5kb)
4.7 Peak heatmap over TSS
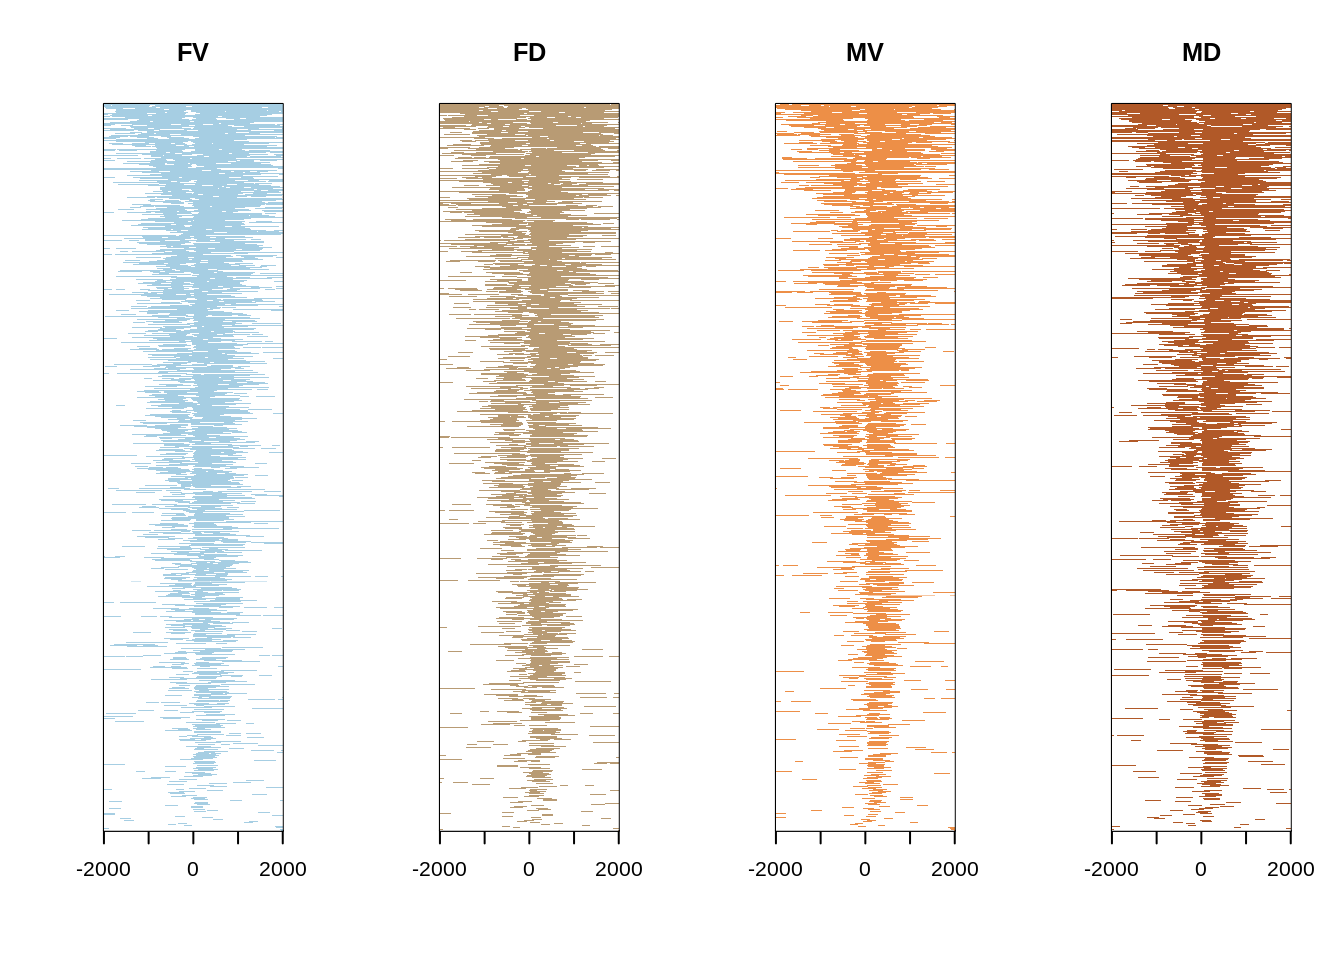
Figure 4.10: Peak heatmap